
|
Christiania Energy relocates headquarters within Odense Harbour
Bunker firm moves to larger waterfront office to accommodate growing team and collaboration needs. |
|
|
|
||

|
HD Hyundai Heavy Industries receives design approval for 20,000-cbm LNG bunkering vessel
Bureau Veritas grants approval in principle following joint development project with South Korean shipbuilder. |
|
|
|
||

|
Peninsula outlines dual role in FuelEU Maritime compliance at Lloyd’s Register panel
Marine fuel supplier discusses challenges for shipowners and opportunities for suppliers under new regulation. |
|
|
|
||

|
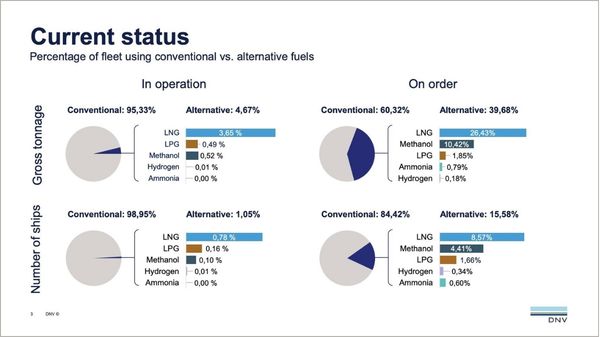
LNG-fuelled container ships dominate January alternative-fuel vessel orders
Container ships accounted for 16 of 20 alternative-fuelled vessels ordered in January, DNV reports. |
|
|
|
||

|
GCMD and CIMAC sign partnership to advance alternative marine fuel readiness
Two-year agreement aims to bridge operational experience with technical standards for decarbonisation solutions. |
|
|
|
||

|
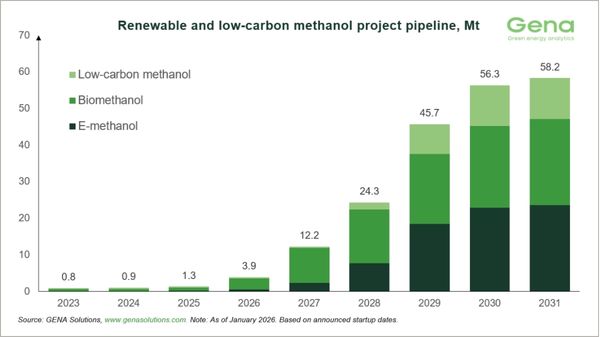
Renewable methanol project pipeline reaches 58.2m tonnes by 2031, GENA reports
Project Navigator Methanol tracks 275 projects, including e-methanol, biomethanol and low-carbon methanol facilities globally. |
|
|
|
||

|
Petrobras adjusts bunker pricing and minimum order volumes at Santos
Brazilian supplier discontinues volume discount tier and lowers minimum order quantity from 1 March. |
|
|
|
||

|
Viking Line secures biogas supply for 2026 after tenfold increase in biofuel use
Åland-based ferry operator aims to maintain 50% biogas blend throughout the year on two vessels. |
|
|
|
||

|
GNV takes delivery of second LNG-powered vessel Aurora from Chinese shipyard
Vessel to enter service on Genoa–Palermo route in April, completing first fleet renewal phase. |
|
|
|
||

|
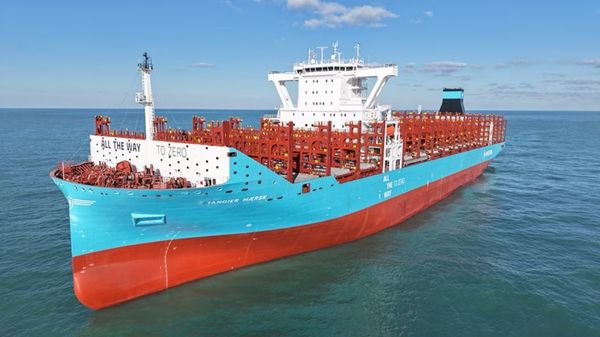
Maersk takes delivery of first methanol-capable vessel in 9,000-teu series
Tangier Maersk is the first of six mid-size container ships with methanol-capable dual-fuel engines. |
|
|
|
||
| Oil and fuel oil hedging market update [News & Insights] |