
| Month | Brent Average($/bbl) | +/- | +/-(%) |
| Nov 2014 | 79.63 | -8.42 | -9.56 |
| Oct 2014 | 88.05 | -10.52 | -10.67 |
| Sep 2014 | 98.57 | -4.83 | -4.67 |
| Aug 2014 | 103.40 | -4.84 | -4.47 |
| Jul 2014 | 108.24 | -3.73 | -3.33 |
| Jun 2014 | 111.97 | +2.79 | +2.56 |
| May 2014 | 109.18 | +1.09 | +1.01 |
| Apr 2014 | 108.09 | -0.34 | -0.32 |
| Mar 2014 | 107.75 | -1.09 | -1.00 |
| Feb 2014 | 108.84 | +1.79 | +1.67 |
| Jan 2014 | 107.05 | -3.65 | -3.30 |
| Dec 2013 | 110.70 | +2.80 | +2.59 |
| Nov 2013 | 107.90 | -1.54 | -1.41 |
| Oct 2013 | 109.44 | -1.81 | -1.63 |
| Sep 2013 | 111.25 | +0.87 | +0.79 |
| Aug 2013 | 110.38 | +3.01 | +2.80 |
| Jul 2013 | 107.37 | +4.03 | +3.90 |
| Jun 2013 | 103.34 | +0.06 | +0.06 |
| May 2013 | 103.28 | -0.15 | -0.15 |
| Apr 2013 | 103.43 | -6.11 | -5.58 |
| Mar 2013 | 109.54 | -6.49 | -5.59 |
| Feb 2013 | 116.03 | +3.75 | +3.34 |
| Jan 2013 | 112.28 | +3.08 | +2.82 |
| Dec 2012 | 109.20 | -0.19 | -0.17 |
| Nov 2012 | 109.39 | -2.08 | -1.87 |
| Oct 2012 | 111.47 | -1.56 | -1.38 |
| Sep 2012 | 113.03 | +0.35 | +0.30 |
| Aug 2012 | 112.68 | +9.96 | +9.70 |
| Jul 2012 | 102.72 | +6.79 | +7.08 |
| Jun 2012 | 95.93 | -14.36 | -13.02 |
| May 2012 | 110.29 | -10.20 | -8.47 |
| Apr 2012 | 120.49 | -4.05 | -3.25 |
| Mar 2012 | 124.54 | +5.48 | +4.60 |
| Feb 2012 | 119.06 | +7.61 | +6.83 |
| Jan 2012 | 111.45 | +3.73 | +3.46 |
| Dec 2011 | 107.72 | -2.76 | -2.50 |
| Nov 2011 | 110.48 | +1.69 | +1.55 |
| Oct 2011 | 108.79 | -0.98 | -0.89 |
| Sep 2011 | 109.77 | -0.16 | -0.15 |
| Aug 2011 | 109.93 | -6.82 | -5.84 |
| Jul 2011 | 116.75 | +3.03 | +2.66 |
| Jun 2011 | 113.72 | -0.80 | -0.70 |
| May 2011 | 114.52 | -8.57 | -6.96 |
| Apr 2011 | 123.09 | +8.42 | +7.34 |
| Mar 2011 | 114.67 | +10.64 | +10.23 |
| Feb 2011 | 104.03 | +7.14 | +7.37 |
| Jan 2011 | 96.89 |
| Month | BIX Average ($/mt) | +/- ($) | +/- (%) |
| Nov 2014 | 649.76 | -50.57 | -7.22 |
| Oct 2014 | 700.33 | -53.49 | -7.10 |
| Sep 2014 | 753.82 | -15.61 | -2.03 |
| Aug 2014 | 769.43 | -13.33 | -1.70 |
| Jul 2014 | 782.76 | -11.05 | -1.39 |
| Jun 2014 | 793.81 | +4.76 | +0.6 |
| May 2014 | 789.05 | +0.09 | +0.01 |
| Apr 2014 | 788.96 | -3.85 | -0.5 |
| Mar 2014 | 792.81 | -0.82 | -0.1 |
| Feb 2014 | 793.63 | +5.78 | +0.7 |
| Jan 2014 | 787.85 | -5.72 | -0.7 |
| Dec 2013 | 793.57 | +11.58 | +1.48 |
| Nov 2013 | 781.99 | -9.31 | -1.18 |
| Oct 2013 | 791.30 | -7.95 | -1.0 |
| Sep 2013 | 799.25 | +2.96 | +0.37 |
| Aug 2013 | 796.29 | +5.44 | +0.7 |
| Jul 2013 | 790.85 | +4.29 | +0.5 |
| Jun 2013 | 786.56 | -0.05 | -0.006 |
| May 2013 | 786.61 | -4.64 | -0.6 |
| Apr 2013 | 791.25 | -25.71 | -3.1 |
| Mar 2013 | 816.96 | -27.77 | -3.3 |
| Feb 2013 | 844.73 | +21.31 | +2.6 |
| Jan 2013 | 823.42 | +19.38 | +2.4 |
| Dec 2012 | 804.04 | -6.05 | -0.7 |
| Nov 2012 | 810.09 | -23.85 | -2.9 |
| Oct 2012 | 833.94 | -19.14 | -2.2 |
| Sep 2012 | 853.08 | +20.09 | +2.4 |
| Aug 2012 | 832.99 | +47.42 | +6.0 |
| Jul 2012 | 785.57 | +10.62 | +1.4 |
| Jun 2012 | 774.95 | -70.59 | -8.3 |
| May 2012 | 845.54 | -43.51 | -4.9 |
| Apr 2012 | 889.05 | -13.09 | -1.5 |
| Mar 2012 | 902.14 | +28.38 | +3.2 |
| Feb 2012 | 873.76 | +24.73 | +2.9 |
| Jan 2012 | 849.03 | +30.85 | +3.8 |
| Dec 2011 | 818.18 | -16.64 | -2.0 |
| Nov 2011 | 834.82 | +20.21 | +2.5 |
| Oct 2011 | 814.61 | -5.29 | -0.6 |
| Sep 2011 | 819.90 | +0.52 | +0.06 |
| Aug 2011 | 819.38 | -15.42 | -1.8 |
| Jul 2011 | 834.80 | +11.61 | +1.4 |
| Jun 2011 | 823.19 | +1.11 | +0.1 |
| May 2011 | 822.08 | -24.57 | -2.9 |
| Apr 2011 | 846.65 | +46.40 | +5.8 |
| Mar 2011 | 800.25 | +71.17 | +9.8 |
| Feb 2011 | 729.08 | +62.34 | +9.3 |
| Jan 2011 | 666.74 | +29.67 | +4.7 |
|
Vale joins Global Ethanol Association as founding member
Brazilian mining company becomes founding member of association focused on ethanol use in maritime sector. |
|
|
|
||

|
KPI OceanConnect seeks marine fuel trading intern in Singapore
Bunker supplier advertises role offering exposure to commercial and operational aspects of marine fuel business. |
|
|
|
||

|
CSL Group's Frank Dahan appointed chair of IBIA's Americas regional board
Dahan brings 29 years of marine transportation and energy experience to the role. |
|
|
|
||

|
Lloyd's Register, EXMAR, and Belgium’s Federal Public Service develop interim guidelines for ammonia cargo as fuel
Guidelines expected to receive formal IMO approval in May 2026, enabling ammonia use on gas carriers. |
|
|
|
||

|
DNV to lead Nordic roadmap Phase 2 for zero-carbon shipping transition
Programme will identify green corridors and tackle cost barriers through new financing approaches. |
|
|
|
||
|
Monjasa seeks trader for Dubai operations
Marine fuel supplier recruiting for trading role covering sales, purchasing, and logistics in UAE. |
|
|
|
||

|
IBIA calls for board election nominations ahead of Friday deadline
Association seeks candidates for 2026 board positions with submissions closing 12 December. |
|
|
|
||

|
BMT Bunker adds tanker MT Fraua to fleet
BMT Bunker und Mineralöltransport has expanded its fleet with a new vessel. |
|
|
|
||
|
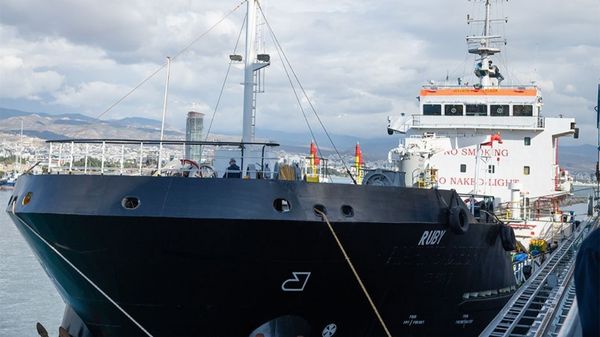
Island Oil expands Cyprus bunkering fleet with vessel Ruby
Island Oil adds second bunkering vessel to strengthen marine fuel supply operations in Cyprus. |
|
|
|
||

|
Wärtsilä and Aalto University extend R&D partnership to accelerate marine decarbonisation
Five-year agreement expands international collaboration on alternative fuels and clean energy technologies. |
|
|
|
||
| Singapore MGO vs ICE Gas Oil [News & Insights] |
| Lowest Rotterdam 380 cSt monthly average since July 2010 [News & Insights] |
| Monthly Fujairah 380 cSt average down 21.8% in two months [News & Insights] |
| Lowest monthly global bunker average since December 2010 [News & Insights] |
| Singapore: lowest 380 cSt monthly average since October 2010 [News & Insights] |