Carnival posts 58.2% jump in Q2 bunker costs
Cruise operator records $379m Q2 net income to 'more than offset the substantial drag from fuel'.
US cruise operator Carnival Corporation & plc (Carnival) has recorded a jump in bunker costs in its financial results for the second fiscal quarter of 2017, which runs between March 1 and May 31.
Bunker fuel expenses rose from last year's figure of $196 million to $310 million, representing an increase of $114 million, or 58.2 percent.
For the first six months of the company's fiscal year (between the start of December and end of May), Carnival saw bunker costs increase $224 million, or 58.5 percent, to $607 million, up from last year's figure of $383 million.
Bunker fuel consumption for the second quarter was 830,000 tonnes - 2.7 percent higher than the 808,000-tonne amount consumed during the prior-year period.
The ferry operator's vessels burned 1,649,000 tonnes during the first half of the year (H1), compared to 1,623,000 tonnes in 2016.
The company paid an average of $374 per metric tonne (pmt) over the three-month period between March and May, compared to $243 pmt during the same quarter in 2016 - representing a rise of $131 pmt, or 53.9 percent.
Fuel consumption per available lower berth day (ALBD) was down to 40.7 from 41.0 in the second quarter, while in H1 the figure was 40.8 compared to 41.6 last year.
2017 forecast
Below is Carnival's fuel price and fuel consumption forecast for 2017.
Third-quarter 2017 forecast
Fuel price per metric tonne: $372
Fuel consumption (metric tonnes): 815,000
Full-year 2017 forecast
Fuel price per metric tonne: $367
Fuel consumption (metric tonnes): 3,300,000
Financial results
In its overall results for the second fiscal quarter of 2017, Carnival posted a net income of $379 million - down from last year's figure of $605 million. H1 net income dipped $17 million to $730 million.
Revenue for the second quarter of 2017 was $3,945 million - $240 million higher than the $3,705 million achieved in 2016. H1 revenue was marginally lower at $7,736 million, compared to last year's $7,357 million result.
Commenting on the results, Arnold Donald, Carnival Corporation & plc President and Chief Executive Officer, said: "Strong execution drove significant operational improvements, which more than offset the substantial drag from fuel and currency, leading to another second quarter adjusted earnings record."
Third-quarter outlook
Third quarter constant currency net revenue yields are expected to be up approximately 4 percent compared to the prior year. Net cruise costs excluding fuel per ALBD in constant currency for the third quarter of 2017 are expected to be in line with the prior year.
Changes in fuel prices (including realized fuel derivatives) and currency exchange rates compared to the prior year are expected to decrease earnings by $0.05 per share.
Based on the above factors, the company expects adjusted earnings per share for the third quarter 2017 to be in the range of $2.16 to $2.20 versus 2016 adjusted earnings per share of $1.92.
Future outlook
Cumulative bookings for the next three quarters are said to be higher at prices that are well ahead of the prior year.
The company expects full-year 2017 net revenue yields in constant currency to be up approximately 3.5 percent compared to the prior year - better than the March guidance of up approximately 3 percent. Also, full-year net cruise costs excluding fuel per ALBD in constant currency are expected to be up approximately 1.5 percent compared to the March guidance of up approximately 1 percent.
Changes in fuel prices (including realized fuel derivatives) and currency exchange rates compared to the prior year are expected to decrease earnings by $0.35 per share.
Taking the above factors into consideration, the company expects full year 2017 adjusted earnings per share to be in the range of $3.60 to $3.70 compared to the March guidance of $3.50 to $3.70 and 2016 adjusted earnings per share of $3.45.

|
How to engineer and manage green shipping fuels | Stanley George, VPS
Effective management strategies and insights for evolving fuel use. |
|
|
|
||
|
Swedish government bans scrubber wastewater discharges
Discharges from open-loop scrubbers to be prohibited in Swedish waters from July 2025. |
|
|
|
||
|
MAN Energy Solutions achieves 100% load milestone for ammonia engine
Latest tests validate fuel injection system throughout the entire load curve. |
|
|
|
||
|
Petrobras secures ISCC EU RED certification for B24 biofuel blend at Rio Grande
Blend consisting of 24% FAME is said to have been rigorously tested to meet international standards. |
|
|
|
||
|
Stolt-Nielsen to fully control Avenir LNG with acquisition
Share purchase agreement to buy all shares from Golar LNG and Aequitas. |
|
|
|
||
|
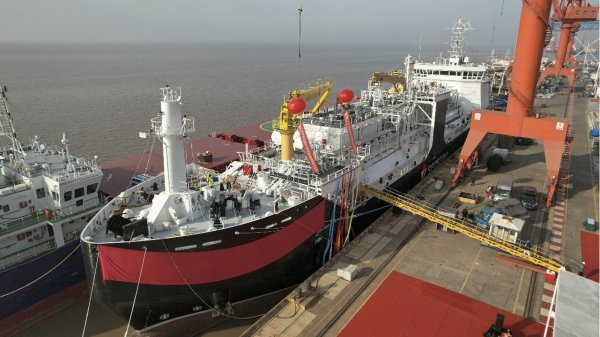
Bureau Veritas supports launch of CIMC SOE's LNG bunkering vessel
Handover of Seaspan Energy's cutting-edge 7,600-cbm vessel completed. |
|
|
|
||
|
Methanol as a marine fuel | Steve Bee, VPS
How environmental legislation has driven the development of low-sulphur fuels and methanol-ready ships. |
|
|
|
||

|
Martin Vorgod elevated to CEO of Global Risk Management
Vorgod, currently CCO at GRM, will officially step in as CEO on December 1, succeeding Peder Møller. |
|
|
|
||
|
Dorthe Bendtsen named interim CEO of KPI OceanConnect
Officer with background in operations and governance to steer firm through transition as it searches for permanent leadership. |
|
|
|
||
|
Bunker Holding revamps commercial department and management team
CCO departs; commercial activities divided into sales and operations. |
|
|
|
||
Related Links
- · AIDA Cruises targets LNG bunkers in Barcelona for newest ship 'before the summer is out' [Insights]
- · Scrubbers installed on 60 Carnival ships [Insights]
- · Carnival inks 12-year deal with Wartsila, targets fuel savings [Insights]
- · Carnival's bunker costs drop 27% in 2016, expects $315m rise next year [Insights]
- · United States [Directory]

