NCL's bunker bill drops $2.58m in Q3
Average fuel price dropped 11.5 percent to $500 per tonne between July and September.
Norwegian Cruise Line Holdings Ltd. (NCL) has confirmed that bunker expenses fell by $2.58 million, or 2.9%, to $86.3 million during the third quarter of 2016, down from $88.8 million during the corresponding period last year.
In the first nine months of 2016, fuel costs declined by $19.3 million, or 7.2%, to $248.5 million, down from last year's figure of $267.8 million.
The average fuel price per metric tonne in the third quarter, net of hedges, decreased by 11.5% to $500 from $565 in 2015.
Hedging:
A loss of $2.5 million was recorded in other expenses related to the ineffective portion of the company's fuel hedge portfolio due to market volatility.
As of 30th September 2016, the company had hedged approximately 90%, 79%, 57%, 48% and 5% of its total projected metric tonnes of fuel consumption for the remainder of 2016 and full year 2017, 2018, 2019 and 2020, respectively.
The following table provides amounts hedged and price per barrel of heavy fuel oil (HFO) and marine gas oil (MGO), which are hedged utilizing U.S. Gulf Coast 3% (USGC) and Brent, respectively.
Q4 2016
% of HFO consumption hedged: 91%
Average USGC price/barrel: $63.47
% of MGO consumption hedged: 87%
Average Brent price/barrel: $35.01
2017
% of HFO consumption hedged: 81%
Average USGC price/barrel: $59.69
% of MGO consumption hedged: 75%
Average Brent price/barrel: $41.11
2018
% of HFO consumption hedged: 68%
Average USGC price/barrel: $54.90
% of MGO consumption hedged: 22%
Average Brent price/barrel: $46.50
2019
% of HFO consumption hedged: 56%
Average USGC price/barrel: $47.82
% of MGO consumption hedged: 21%
Average Brent price/barrel: $49.25
2020
% of HFO consumption hedged: 6%
Average USGC price/barrel: $44.35
% of MGO consumption hedged: 0%
Average Brent price/barrel: ---
Fuel consumption forecast
The company's fuel consumption and pricing forecast for 2016 is as follows:
Fuel consumption in metric tonnes:
Q4 2016: 182,000
FY 2016: 713,000
Fuel price per metric tonne, net of hedges:
Q4 2016: $453
FY 2016: $480
Effect on Adjusted EPS of a 10% change in fuel prices, net of hedges:
Q4 2016: $0.01
FY 2016: $0.01
Overall results
In its overall results, NCL posted a third-quarter net income of $324.4 million, or $1.50 per share, compared with $251.8 million, or $1.09 per share, in 2015.
Adjusted net income was $369.3 million, or $1.62 per share, compared with $311.1 million, or $1.35 per share, last year.
Revenue increased 15.6 percent to $1.5 billion compared with $1.3 billion in 2015. Adjusted net revenue in the period increased 17.0 percent to $1.1 billion compared with $978.2 million in 2015.
Commenting on the results, Frank Del Rio, NCL president and chief executive officer, said: "In 1966, the M/S Sunward departed on her first voyage from Miami to the Caribbean, marking not just the launch of Norwegian Cruise Line, but the modern cruise industry as we know it today. Fast forward fifty years, where we have reached yet another milestone, reporting the highest single quarter revenue and earnings in our history, bolstered by the addition of Norwegian Escape, Oceania Cruises' Sirena and Seven Seas Explorer to our fleet."
Wendy Beck, executive vice president and chief financial officer of NCL, remarked: "We are on track to deliver robust double-digit growth in Adjusted EPS in 2016, despite headwinds from geopolitical events earlier in the year which dampened demand for Mediterranean sailings. Looking to the first half of 2017, where deployment is weighted to Caribbean sailings, advanced bookings are ahead of prior year's record levels at higher prices, while an early look at the full year shows occupancy commensurate with prior year at this same time at slightly lower prices. Recent significant weakening of certain foreign currencies, primarily the British Pound, against the U.S. dollar, combined with an increase in fuel prices have placed pressure on expectations for the coming year. Despite these headwinds, we still anticipate delivering double-digit growth in adjusted EPS in 2017."

|
How to engineer and manage green shipping fuels | Stanley George, VPS
Effective management strategies and insights for evolving fuel use. |
|
|
|
||
|
Swedish government bans scrubber wastewater discharges
Discharges from open-loop scrubbers to be prohibited in Swedish waters from July 2025. |
|
|
|
||
|
MAN Energy Solutions achieves 100% load milestone for ammonia engine
Latest tests validate fuel injection system throughout the entire load curve. |
|
|
|
||
|
Petrobras secures ISCC EU RED certification for B24 biofuel blend at Rio Grande
Blend consisting of 24% FAME is said to have been rigorously tested to meet international standards. |
|
|
|
||
|
Stolt-Nielsen to fully control Avenir LNG with acquisition
Share purchase agreement to buy all shares from Golar LNG and Aequitas. |
|
|
|
||
|
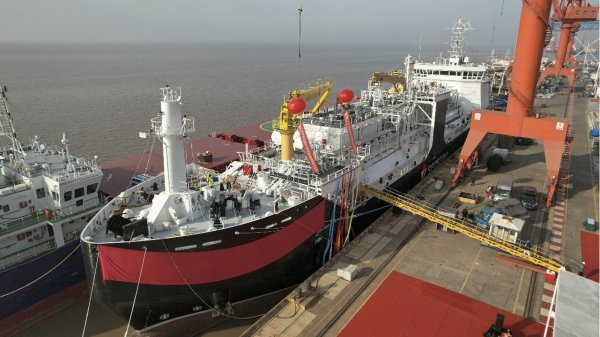
Bureau Veritas supports launch of CIMC SOE's LNG bunkering vessel
Handover of Seaspan Energy's cutting-edge 7,600-cbm vessel completed. |
|
|
|
||
|
Methanol as a marine fuel | Steve Bee, VPS
How environmental legislation has driven the development of low-sulphur fuels and methanol-ready ships. |
|
|
|
||

|
Martin Vorgod elevated to CEO of Global Risk Management
Vorgod, currently CCO at GRM, will officially step in as CEO on December 1, succeeding Peder Møller. |
|
|
|
||
|
Dorthe Bendtsen named interim CEO of KPI OceanConnect
Officer with background in operations and governance to steer firm through transition as it searches for permanent leadership. |
|
|
|
||

|
Bunker Holding revamps commercial department and management team
CCO departs; commercial activities divided into sales and operations. |
|
|
|
||
Related Links
- · Norwegian Jewel retrofitted with scrubber technology [Insights]
- · NCL spends $11m less on fuel as average bunker price falls 16% [Insights]
- · Alfa Laval systems have 'strong presence' on NCL ship [Insights]
- · Fuel costs up 9.9% for NCL in 2015 [Insights]

