Countdown to Copenhagen (Part 2): Marine bunker emissions in OECD countries
Marine fuel emissions in Europe, North America and the Pacific are examined in our second feature article in the run up to Copenhagen.
In the second of our "Countdown to Copenhagen" series of articles, we look at CO2 emissions from marine fuels in OECD (Organisation for Economic Co-operation and Development) countries located in Europe, North America and the Pacific.
The countries are as follows:
OECD North America - Canada, Mexico, United States
OECD Pacific - Australia, Japan, Korea, New Zealand
OECD Europe - Belgium, Denmark, Finland, France, Germany, Greece, Iceland, Ireland, Italy, Netherlands, Norway, Poland, Portugal, Spain, Sweden, Turkey, United Kingdom
According to recent data published by the International Energy Agency(IEA), OECD Europe accounted for 174.05 million tonnes of CO2, or 28.5 percent, of global emissions from marine fuels in 2007, compared with 122.1 million tonnes, or 35 percent of worldwide marine bunker emissions in 1971. The 2007 data therefore represents a 42.5 percent increase in CO2 emissions over this 36-year period even though the percentage of global bunker emissions has fallen by 6.5 percent.
OECD North America accounted for 100.67 million tonnes of CO2, or 16.5 percent of the world's marine fuel emissions in 2007, up 74 million tonnes from 26.67 million tonnes in 1971. Significantly, this represents a 277.5 percent increase in CO2 emissions in just under four decades.
Meanwhile, OECD Pacific emissions from marine fuels were 53.17 million tonnes of CO2 in 2007 compared with 57.55 million tonnes in 1971, showing that CO2 emissions have actually fallen both in real terms and as a percentage of global marine fuel emissions.
Please find a table below, which provides a summary of CO2 emissions in OECD Europe, OECD North America and OECD Pacific.
| Year | OECD Europe | % | OECD Namerica | % | OECD Pacific | % | Global (Marine Fuels) |
| 1971 | 122.1 | 35.4 | 26.67 | 7.7 | 57.55 | 16.7 | 344.5 |
| 1972 | 134.49 | 37.3 | 26 | 7.2 | 55.63 | 15.4 | 360.4 |
| 1973 | 135.05 | 35.5 | 33.34 | 8.8 | 65.12 | 17.1 | 380.8 |
| 1974 | 115.5 | 32.6 | 35.4 | 10.0 | 65.25 | 18.4 | 354.5 |
| 1975 | 112.87 | 34.3 | 36.51 | 11.1 | 70.48 | 21.4 | 328.6 |
| 1976 | 117.96 | 34.8 | 48.24 | 14.2 | 56.46 | 16.7 | 338.7 |
| 1977 | 112.53 | 33.2 | 58.54 | 17.3 | 52.23 | 15.4 | 338.5 |
| 1978 | 113.34 | 33.3 | 71.98 | 21.2 | 47.12 | 13.9 | 340.2 |
| 1979 | 107.76 | 30.7 | 83.89 | 23.9 | 48.64 | 13.8 | 351.4 |
| 1980 | 99.26 | 28.9 | 94.91 | 27.6 | 44.06 | 12.8 | 344 |
| 1981 | 97.17 | 30.6 | 84.59 | 26.6 | 41.19 | 13.0 | 318 |
| 1982 | 93.09 | 32.6 | 68.09 | 23.9 | 29.43 | 10.3 | 285.4 |
| 1983 | 86.18 | 32.4 | 60.86 | 22.9 | 27.41 | 10.3 | 265.9 |
| 1984 | 82.77 | 30.7 | 60.12 | 22.3 | 28.39 | 10.5 | 269.2 |
| 1985 | 89.76 | 30.8 | 57.76 | 19.8 | 28.63 | 9.8 | 291.7 |
| 1986 | 105.39 | 33.9 | 56.42 | 18.2 | 24.53 | 7.9 | 310.6 |
| 1987 | 102.97 | 33.7 | 56.53 | 18.5 | 23.91 | 7.8 | 305.8 |
| 1988 | 104.91 | 32.6 | 60.99 | 19.0 | 23.42 | 7.3 | 321.8 |
| 1989 | 105.42 | 32.8 | 63.93 | 19.9 | 25.23 | 7.8 | 321.5 |
| 1990 | 110.68 | 31.0 | 95.58 | 26.8 | 26.11 | 7.3 | 356.9 |
| 1991 | 109.43 | 29.5 | 100.86 | 27.2 | 29.36 | 7.9 | 370.4 |
| 1992 | 110.81 | 27.9 | 104.92 | 26.4 | 31.87 | 8.0 | 396.9 |
| 1993 | 113.63 | 29.5 | 92.33 | 24.0 | 36.75 | 9.5 | 384.9 |
| 1994 | 109.61 | 28.1 | 90.6 | 23.2 | 38.51 | 9.9 | 389.7 |
| 1995 | 113.27 | 28.2 | 95.57 | 23.8 | 37.04 | 9.2 | 402 |
| 1996 | 120.11 | 29.5 | 90.33 | 22.2 | 33.76 | 8.3 | 406.9 |
| 1997 | 131.1 | 31.1 | 79.1 | 18.8 | 39.31 | 9.3 | 421.8 |
| 1998 | 135.95 | 31.9 | 78.34 | 18.4 | 40.77 | 9.6 | 425.8 |
| 1999 | 130.42 | 28.6 | 89.14 | 19.5 | 41.68 | 9.1 | 456.6 |
| 2000 | 138.53 | 29.7 | 96.39 | 20.7 | 40.86 | 8.8 | 466 |
| 2001 | 141.81 | 32.3 | 68.38 | 15.6 | 37.86 | 8.6 | 439 |
| 2002 | 144.86 | 31.9 | 78.06 | 17.2 | 37.71 | 8.3 | 454.8 |
| 2003 | 146.22 | 31.4 | 64.57 | 13.9 | 41.23 | 8.8 | 466 |
| 2004 | 157.2 | 30.1 | 81.07 | 15.5 | 44.42 | 8.5 | 521.7 |
| 2005 | 164.34 | 29.9 | 86.34 | 15.7 | 56.73 | 10.3 | 549.7 |
| 2006 | 172.53 | 29.7 | 92.57 | 15.9 | 56.09 | 9.7 | 580.6 |
| 2007 | 174.05 | 28.5 | 100.67 | 16.5 | 53.17 | 8.7 | 610.4 |
|
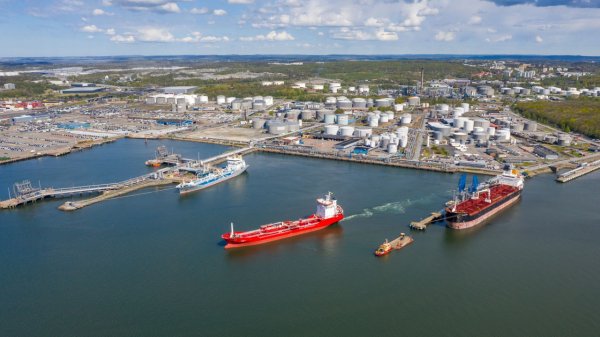
Swedish biomethane bunkered in Gothenburg
Test delivery performed by St1 and St1 Biokraft, who aim to become large-scale suppliers. |
|
|
|
||

|
Cockett to be closed down after 45 years
End of an era as shareholders make decision based on 'non-core nature' of Cockett's business. |
|
|
|
||

|
Petrobras confirms prompt availability of VLS B24 at Rio Grande
Lead time for barge deliveries currently five days. |
|
|
|
||

|
IMO approves pricing mechanism based on GHG intensity thresholds
Charges to be levied on ships that do not meet yearly GHG fuel intensity reduction targets. |
|
|
|
||
|
VARO Energy expands renewable portfolio with Preem acquisition
All-cash transaction expected to complete in the latter half of 2025. |
|
|
|
||
|
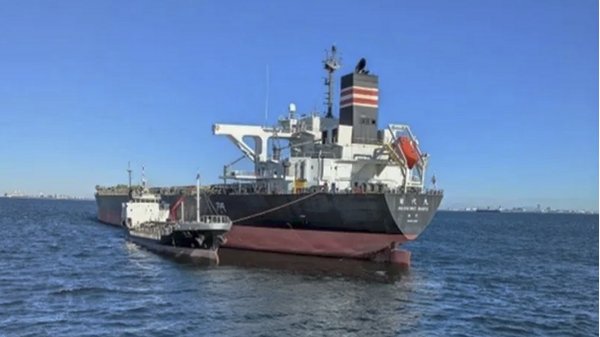
NYK trials biofuel in milestone coal carrier test
Vessel is used to test biofuel for domestic utility company. |
|
|
|
||
|
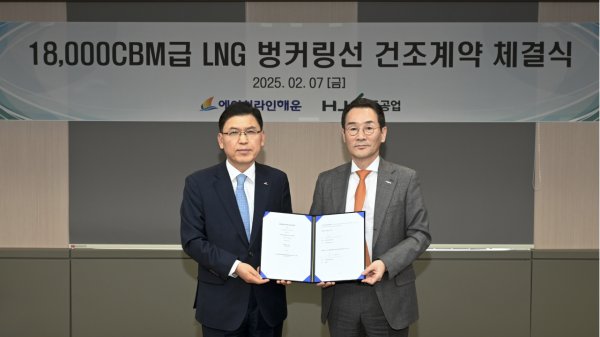
H-Line Shipping orders LNG bunkering vessel
Vessel with 18,000-cbm capacity to run on both LNG and MDO. |
|
|
|
||

|
How to engineer and manage green shipping fuels | Stanley George, VPS
Effective management strategies and insights for evolving fuel use. |
|
|
|
||
|
Swedish government bans scrubber wastewater discharges
Discharges from open-loop scrubbers to be prohibited in Swedish waters from July 2025. |
|
|
|
||
|
MAN Energy Solutions achieves 100% load milestone for ammonia engine
Latest tests validate fuel injection system throughout the entire load curve. |
|
|
|
||

