Singapore bunker sales fall for third consecutive year
Bunker sales in 2014 declined by 265,400 tonnes, or 0.6 percent, compared to the previous year.
Bunker sales fell in Singapore for the third consecutive year during 2014, according to data released by the Maritime and Port Authority of Singapore (MPA).
Accumulated bunker sales for the year were 42,416,800 tonnes, which represents a decrease of 265,400 tonnes, or 0.6 percent, compared to 2013 (42,682,200 tonnes).
The figure was also below the volumes sold in 2012 (42,685,300 tonnes) and 2011 (43,153,800 tonnes), but above the 40,873,400 tonnes sold in 2010.
Sales of 380 centistoke (cSt) - Singapore's largest-selling bunker grade - declined by 249,000 tonnes, or 0.8 percent, from 32,070,100 tonnes to 31,821,100 tonnes. It is the third annual sales drop in a row.
500 cSt volumes rose for the fifth consecutive year in 2014 to 8,096,700 tonnes. The figure was 435,300 tonnes, or 5.7 percent, higher than the 7,661,400 tonnes sold in 2013.
Volumes of 180 cSt were down for the fourth year in a row in 2014 with sales of 747,800 tonnes - down 202,500 tonnes, or 21.3 percent, on the 950,300 tonnes recorded the previous year.
Standard marine gas oil (MGO) sales also decreased in 2014 as Asia's leading bunker port recorded sales of 1,022,300 tonnes, representing a fall of 160,500 tonnes, or 13.6 percent, compared to 2013.
Below are tables of bunker sales in Singapore for each fuel grade in 2014, 2013, 2012 and 2011 with accumulated totals in the bottom row.
| 2014 | Total | 500cst | 380cst | 180cst | MGO |
| Jan | 3,557.8 | 635.7 | 2,754.8 | 42.9 | 70.4 |
| Feb | 3,277.4 | 524.1 | 2,522.0 | 73.8 | 91.7 |
| Mar | 3,184.9 | 574.1 | 2,402.7 | 57.8 | 88.3 |
| Apr | 3,812.9 | 747.9 | 2,814.2 | 79.9 | 98.7 |
| May | 3,637.6 | 718.2 | 2,701.9 | 64.4 | 90.0 |
| Jun | 3,373.8 | 668.7 | 2,479.8 | 78.7 | 80.3 |
| Jul | 3,662.6 | 737.8 | 2,718.2 | 57.7 | 86.3 |
| Aug | 3,668.8 | 728.1 | 2,736.7 | 58.0 | 82.8 |
| Sep | 3,521.5 | 677.6 | 2,648.8 | 57.6 | 89.9 |
| Oct | 3,593.6 | 694.6 | 2,696.8 | 55.1 | 94.1 |
| Nov | 3,548.4 | 709.6 | 2,660.6 | 58.7 | 64.0 |
| Dec | 3,577.5 | 680.3 | 2,684.6 | 63.2 | 85.8 |
| Total | 42,416.8 | 8,096.7 | 31,821.1 | 747.8 | 1,022.3 |
| 2013 | Total | 500cst | 380cst | 180cst | MGO |
| Jan | 3,787.6 | 581.8 | 2,929.3 | 99.7 | 119.3 |
| Feb | 3,076.4 | 492.0 | 2,365.7 | 69.9 | 84.5 |
| Mar | 3,362.7 | 580.8 | 2,512.7 | 78.8 | 104.8 |
| Apr | 3,647.9 | 633.2 | 2,713.7 | 94.2 | 113.9 |
| May | 3,529.0 | 644.3 | 2,633.2 | 89.5 | 93.7 |
| Jun | 3,478.2 | 641.6 | 2,588.7 | 81.1 | 95.0 |
| Jul | 3,740.8 | 714.6 | 2,773.0 | 81.7 | 107.3 |
| Aug | 3,488.1 | 693.0 | 2,570.9 | 69.7 | 96.7 |
| Sep | 3,610.5 | 684.9 | 2,673.5 | 77.5 | 104.1 |
| Oct | 3,780.6 | 688.8 | 2,866.6 | 71.4 | 91.6 |
| Nov | 3,373.1 | 652.2 | 2,525.0 | 67.4 | 74.5 |
| Dec | 3,802.4 | 654.2 | 2,917.8 | 69.4 | 97.4 |
| Total | 42,682.2 | 7,661.4 | 32,070.1 | 950.3 | 1182.8 |
| 2012 | Total | 500cst | 380cst | 180cst | MGO |
| Jan | 3,668.5 | 406.3 | 3,019.0 | 115.3 | 113.3 |
| Feb | 3,092.7 | 407.2 | 2,436.9 | 112.3 | 128.7 |
| Mar | 3,608.8 | 486.9 | 2,885,4 | 106.1 | 126.4 |
| Apr | 3,735.4 | 515.3 | 2,982.6 | 103.5 | 129.9 |
| May | 3,985.7 | 591.5 | 3,144.6 | 117.50 | 128.4 |
| Jun | 3,646.9 | 553.6 | 2,883.3 | 85.6 | 123.4 |
| Jul | 3,665.2 | 503.5 | 2,924.4 | 110.0 | 114.7 |
| Aug | 3,556.0 | 568.1 | 2,756.7 | 107.9 | 120.1 |
| Sep | 3,326.4 | 535.9 | 2,570.1 | 87.7 | 118.1 |
| Oct | 3,508.4 | 549.1 | 2,747.0 | 92.7 | 114.2 |
| Nov | 3,275.6 | 566.7 | 2,491.9 | 92.3 | 118.6 |
| Dec | 3,625.7 | 541.4 | 2,843.6 | 116.1 | 118.3 |
| Total | 42,685.3 | 6,225.5 | 33,685.5 | 1,247.0 | 1,454.1 |
| 2011 | Total | 500cst | 380cst | 180cst | MGO |
| Jan | 3,642.4 | 480.3 | 2,841.2 | 171.0 | 134.0 |
| Feb | 3,268.8 | 438.7 | 2,544.2 | 151.8 | 111.7 |
| Mar | 3,520.7 | 472.9 | 2,747.8 | 146.5 | 134.9 |
| Apr | 3,248.5 | 425.4 | 2,541.5 | 132.2 | 118.9 |
| May | 3,621.9 | 475.7 | 2,873.7 | 130.6 | 123.2 |
| Jun | 3,859.2 | 515.2 | 3,031.9 | 141.1 | 143.4 |
| Jul | 3,642.9 | 476.6 | 2,883.7 | 135.2 | 127.8 |
| Aug | 3,815.3 | 470.2 | 3,050.4 | 133.6 | 149.3 |
| Sep | 3,568.4 | 468.1 | 2,836.8 | 132.0 | 125.6 |
| Oct | 3,546.2 | 385.3 | 2,867.1 | 131.9 | 145.1 |
| Nov | 3,615.4 | 537.6 | 2,800.7 | 124.2 | 126.8 |
| Dec | 3,804.1 | 431.8 | 3,103.1 | 110.9 | 128.9 |
| Total | 43,153.6 | 5,577.7 | 34,122.1 | 1,641.0 | 1,569.6 |
|
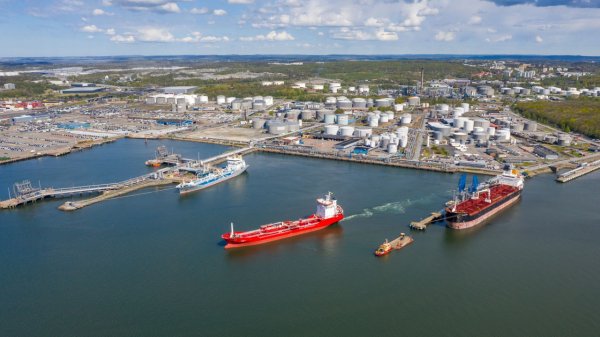
Swedish biomethane bunkered in Gothenburg
Test delivery performed by St1 and St1 Biokraft, who aim to become large-scale suppliers. |
|
|
|
||

|
Cockett to be closed down after 45 years
End of an era as shareholders make decision based on 'non-core nature' of Cockett's business. |
|
|
|
||

|
Petrobras confirms prompt availability of VLS B24 at Rio Grande
Lead time for barge deliveries currently five days. |
|
|
|
||

|
IMO approves pricing mechanism based on GHG intensity thresholds
Charges to be levied on ships that do not meet yearly GHG fuel intensity reduction targets. |
|
|
|
||

|
VARO Energy expands renewable portfolio with Preem acquisition
All-cash transaction expected to complete in the latter half of 2025. |
|
|
|
||
|
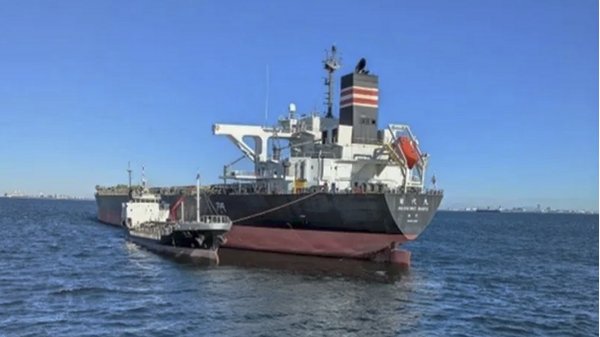
NYK trials biofuel in milestone coal carrier test
Vessel is used to test biofuel for domestic utility company. |
|
|
|
||
|
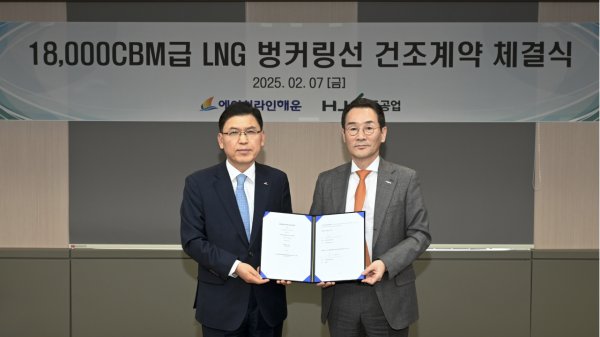
H-Line Shipping orders LNG bunkering vessel
Vessel with 18,000-cbm capacity to run on both LNG and MDO. |
|
|
|
||

|
How to engineer and manage green shipping fuels | Stanley George, VPS
Effective management strategies and insights for evolving fuel use. |
|
|
|
||

|
Swedish government bans scrubber wastewater discharges
Discharges from open-loop scrubbers to be prohibited in Swedish waters from July 2025. |
|
|
|
||
|
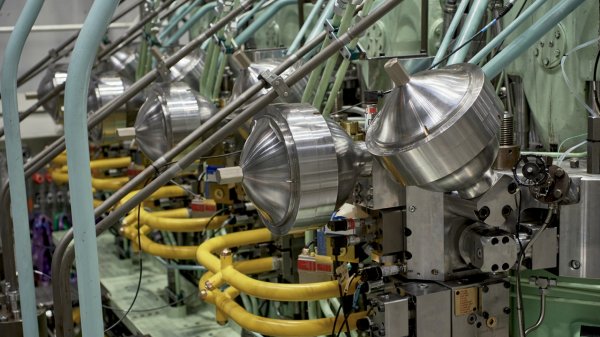
MAN Energy Solutions achieves 100% load milestone for ammonia engine
Latest tests validate fuel injection system throughout the entire load curve. |
|
|
|
||
Related Links
- · Singapore: lowest 380 cSt monthly average since October 2010 [Insights]
- · Singapore: lowest 380 cSt monthly average since October 2010 [Insights]
- · Singapore bunker sales rise for second month [Insights]
- · Singapore: month-on-month sales up, year-on-year volumes down [Insights]
- · Singapore: Fifth decline in bunker sales in six months [Insights]
- · Singapore [Directory]
- · Singapore [Directory]

