WTI vs BIX price comparison
Analysis of WTI crude vs the BIX global bunker price.
The average monthly WTI crude price fell at a more significant rate than the global bunker average for the seventh month in a row in January, according to Bunker Index (BIX) and New York Mercantile Exchange (NYMEX) price data.
The WTI settlement average decreased by $11.95 per barrel, or 20.15 percent, to $47.36 per barrel in January. During the same period, the BIX global bunker average was down $65.54 per tonne, or 11.70 percent, to $494.61 per tonne.
Since June 2014, the WTI monthly average has declined by $57.77 per barrel, or 54.95 percent, from $105.13 to $47.36 per barrel, whilst the BIX monthly global average has declined by $299.20 per tonne, or 37.69 percent, from $793.81 to $494.61 per tonne.
Over the last 12 months - between January 2014 and January 2015 - the WTI monthly average has fallen by $47.46 per barrel, or 50.05 percent, from $94.82 to $47.36 per barrel, whilst the BIX monthly global average has declined by $293.24 per tonne, or 37.22 percent, from $787.85 to $494.61 per tonne.
Please find below tables of monthly WTI crude settlement averages and BIX global bunker averages between January 2011 and January 2015.
| Month | WTI Average($/bbl) | +/- | +/-(%) |
| Jan 2015 | 47.36 | -11.95 | -20.15 |
| Dec 2014 | 59.31 | -16.17 | -21.42 |
| Nov 2014 | 75.48 | -8.85 | -10.49 |
| Oct 2014 | 84.33 | -8.80 | -9.45 |
| Sep 2014 | 93.13 | -2.32 | -2.43 |
| Aug 2014 | 95.45 | -7.00 | -6.83 |
| Jul 2014 | 102.45 | -2.68 | -2.26 |
| Jun 2014 | 105.13 | +3.23 | +3.17 |
| May 2014 | 101.90 | -0.12 | -0.12 |
| Apr 2014 | 102.02 | +1.52 | +1.51 |
| Mar 2014 | 100.50 | -0.18 | -0.18 |
| Feb 2014 | 100.68 | +5.86 | +6.18 |
| Jan 2014 | 94.82 | -3.07 | -3.14 |
| Dec 2013 | 97.89 | +4.02 | +4.28 |
| Nov 2013 | 93.87 | -6.70 | -6.66 |
| Oct 2013 | 100.57 | -5.67 | -5.34 |
| Sep 2013 | 106.24 | -0.31 | -0.29 |
| Aug 2013 | 106.55 | +2.01 | +1.92 |
| Jul 2013 | 104.54 | +8.74 | +9.12 |
| Jun 2013 | 95.80 | +1.05 | +1.11 |
| May 2013 | 94.75 | +0.68 | +0.74 |
| Apr 2013 | 92.07 | -0.91 | -0.98 |
| Mar 2013 | 92.98 | -0.39 | -0.42 |
| Feb 2013 | 93.37 | -1.52 | -1.60 |
| Jan 2013 | 94.89 | +6.64 | +7.52 |
| Dec 2012 | 88.25 | +1.49 | +1.72 |
| Nov 2012 | 86.76 | -2.81 | -3.14 |
| Oct 2012 | 89.57 | -4.99 | -5.28 |
| Sep 2012 | 94.56 | +0.39 | +0.41 |
| Aug 2012 | 94.17 | +6.24 | +7.10 |
| Jul 2012 | 87.93 | +5.53 | +6.71 |
| Jun 2012 | 82.40 | -12.32 | -13.00 |
| May 2012 | 94.72 | -8.63 | -8.35 |
| Apr 2012 | 103.35 | -2.90 | -2.73 |
| Mar 2012 | 106.25 | +3.84 | +3.75 |
| Feb 2012 | 102.41 | +2.09 | +2.08 |
| Jan 2012 | 100.32 | +1.74 | +1.77 |
| Dec 2011 | 98.58 | +1.42 | +1.46 |
| Nov 2011 | 97.16 | +10.73 | +12.41 |
| Oct 2011 | 86.43 | +0.82 | +0.96 |
| Sep 2011 | 85.61 | -0.75 | -0.87 |
| Aug 2011 | 86.36 | -10.99 | -11.29 |
| Jul 2011 | 97.35 | +1.01 | +1.05 |
| Jun 2011 | 96.34 | -5.02 | -4.95 |
| May 2011 | 101.36 | -8.69 | -7.90 |
| Apr 2011 | 110.05 | +7.06 | +6.86 |
| Mar 2011 | 102.98 | +12.96 | +14.39 |
| Feb 2011 | 90.03 | +0.45 | +0.50 |
| Jan 2011 | 89.58 |
| Month | BIX Average ($/mt) | +/- ($) | +/- (%) |
| Jan 2015 | 494.61 | -65.54 | -11.70 |
| Dec 2014 | 560.15 | -89.61 | -13.79 |
| Nov 2014 | 649.76 | -50.57 | -7.22 |
| Oct 2014 | 700.33 | -53.49 | -7.10 |
| Sep 2014 | 753.82 | -15.61 | -2.03 |
| Aug 2014 | 769.43 | -13.33 | -1.70 |
| Jul 2014 | 782.76 | -11.05 | -1.39 |
| Jun 2014 | 793.81 | +4.76 | +0.6 |
| May 2014 | 789.05 | +0.09 | +0.01 |
| Apr 2014 | 788.96 | -3.85 | -0.5 |
| Mar 2014 | 792.81 | -0.82 | -0.1 |
| Feb 2014 | 793.63 | +5.78 | +0.7 |
| Jan 2014 | 787.85 | -5.72 | -0.7 |
| Dec 2013 | 793.57 | +11.58 | +1.48 |
| Nov 2013 | 781.99 | -9.31 | -1.18 |
| Oct 2013 | 791.30 | -7.95 | -1.0 |
| Sep 2013 | 799.25 | +2.96 | +0.4 |
| Aug 2013 | 796.29 | +5.44 | +0.7 |
| Jul 2013 | 790.85 | +4.29 | +0.5 |
| Jun 2013 | 786.56 | -0.05 | -0.006 |
| May 2013 | 786.61 | -4.64 | -0.6 |
| Apr 2013 | 791.25 | -25.71 | -3.1 |
| Mar 2013 | 816.96 | -27.77 | -3.3 |
| Feb 2013 | 844.73 | +21.31 | +2.6 |
| Jan 2013 | 823.42 | +19.38 | +2.4 |
| Dec 2012 | 804.04 | -6.05 | -0.7 |
| Nov 2012 | 810.09 | -23.85 | -2.9 |
| Oct 2012 | 833.94 | -19.14 | -2.2 |
| Sep 2012 | 853.08 | +20.09 | +2.4 |
| Aug 2012 | 832.99 | +47.42 | +6.0 |
| Jul 2012 | 785.57 | +10.62 | +1.4 |
| Jun 2012 | 774.95 | -70.59 | -8.3 |
| May 2012 | 845.54 | -43.51 | -4.9 |
| Apr 2012 | 889.05 | -13.09 | -1.5 |
| Mar 2012 | 902.14 | +28.38 | +3.2 |
| Feb 2012 | 873.76 | +24.73 | +2.9 |
| Jan 2012 | 849.03 | +30.85 | +3.8 |
| Dec 2011 | 818.18 | -16.64 | -2.0 |
| Nov 2011 | 834.82 | +20.21 | +2.5 |
| Oct 2011 | 814.61 | -5.29 | -0.6 |
| Sep 2011 | 819.90 | +0.52 | +0.06 |
| Aug 2011 | 819.38 | -15.42 | -1.8 |
| Jul 2011 | 834.80 | +11.61 | +1.4 |
| Jun 2011 | 823.19 | +1.11 | +0.1 |
| May 2011 | 822.08 | -24.57 | -2.9 |
| Apr 2011 | 846.65 | +46.40 | +5.8 |
| Mar 2011 | 800.25 | +71.17 | +9.8 |
| Feb 2011 | 729.08 | +62.34 | +9.3 |
| Jan 2011 | 666.74 | +29.67 | +4.7 |

|
Swedish biomethane bunkered in Gothenburg
Test delivery performed by St1 and St1 Biokraft, who aim to become large-scale suppliers. |
|
|
|
||

|
Cockett to be closed down after 45 years
End of an era as shareholders make decision based on 'non-core nature' of Cockett's business. |
|
|
|
||

|
Petrobras confirms prompt availability of VLS B24 at Rio Grande
Lead time for barge deliveries currently five days. |
|
|
|
||

|
IMO approves pricing mechanism based on GHG intensity thresholds
Charges to be levied on ships that do not meet yearly GHG fuel intensity reduction targets. |
|
|
|
||

|
VARO Energy expands renewable portfolio with Preem acquisition
All-cash transaction expected to complete in the latter half of 2025. |
|
|
|
||

|
NYK trials biofuel in milestone coal carrier test
Vessel is used to test biofuel for domestic utility company. |
|
|
|
||

|
H-Line Shipping orders LNG bunkering vessel
Vessel with 18,000-cbm capacity to run on both LNG and MDO. |
|
|
|
||

|
How to engineer and manage green shipping fuels | Stanley George, VPS
Effective management strategies and insights for evolving fuel use. |
|
|
|
||

|
Swedish government bans scrubber wastewater discharges
Discharges from open-loop scrubbers to be prohibited in Swedish waters from July 2025. |
|
|
|
||
|
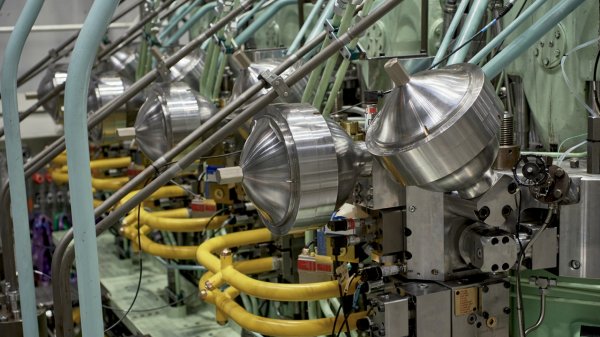
MAN Energy Solutions achieves 100% load milestone for ammonia engine
Latest tests validate fuel injection system throughout the entire load curve. |
|
|
|
||
Related Links
- · Brent drops more than global bunker average for seventh consecutive month [Insights]
- · Fourth consecutive month of high price volatility [Insights]
- · Lowest monthly global bunker average since July 2009 [Insights]
- · Singapore 380 cSt average drops to lowest level in almost six years [Insights]
- · Fujairah 380 cSt average plummets 20.4% in January [Insights]

